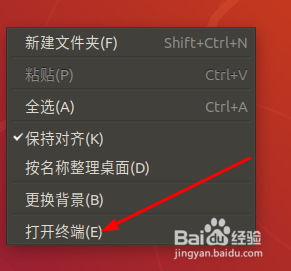
1、打开Ubuntu虚拟机,在桌面空白处右键,点击打开终端。
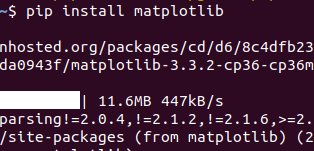
2、先安装Matplotlib包,使用pip包管理工具,命令如下:
pip install matplotlib
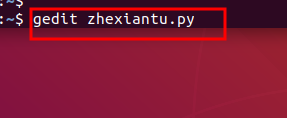
3、使用gedit创建一个python文件,命令如下:
gedit zhexiantu.py
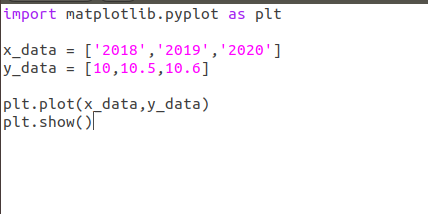
4、在gedit.pyz中写代码如下:
import matplotlib.pyplot as plt
x_data = ['2018','2019','2020']
y_data = [10,10.5,10.6]
plt.plot(x_data,y_data)
plt.show()
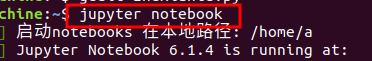
5、在终端启动jupyter notebook,命令如下:
jupyter notebook
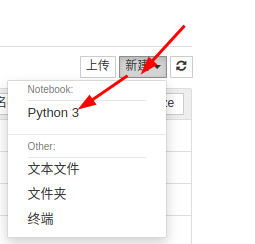
6、在弹出的浏览器,点击新建 -- Python3
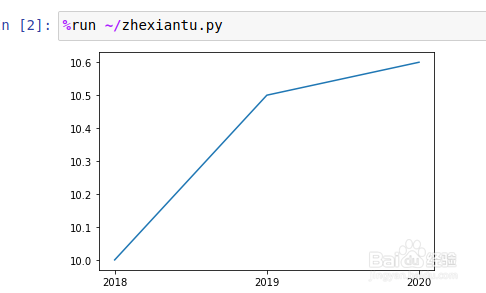
7、在输入框输入程序地址,点击运行,折线图效果如下图所示。
%run ~/zhexiantu.py